Introduction: India’s Economic Acceleration
India stands at a critical juncture in its economic development. According to recently released First Advance Estimates, India’s GDP growth for FY26 (2025-26) is projected at 7.4%, significantly higher than the previous year’s 6.5%. This figure tells a compelling story of how policy reforms, robust domestic demand, and a manufacturing renaissance are positioning India as the world’s fastest-growing major economy. For GPSC aspirants, this data is crucial not just for current affairs preparation, but for developing a comprehensive understanding of India’s macroeconomic framework.
I. The Growth Story: Why 7.4% Matters
A. Historical Context and Global Position
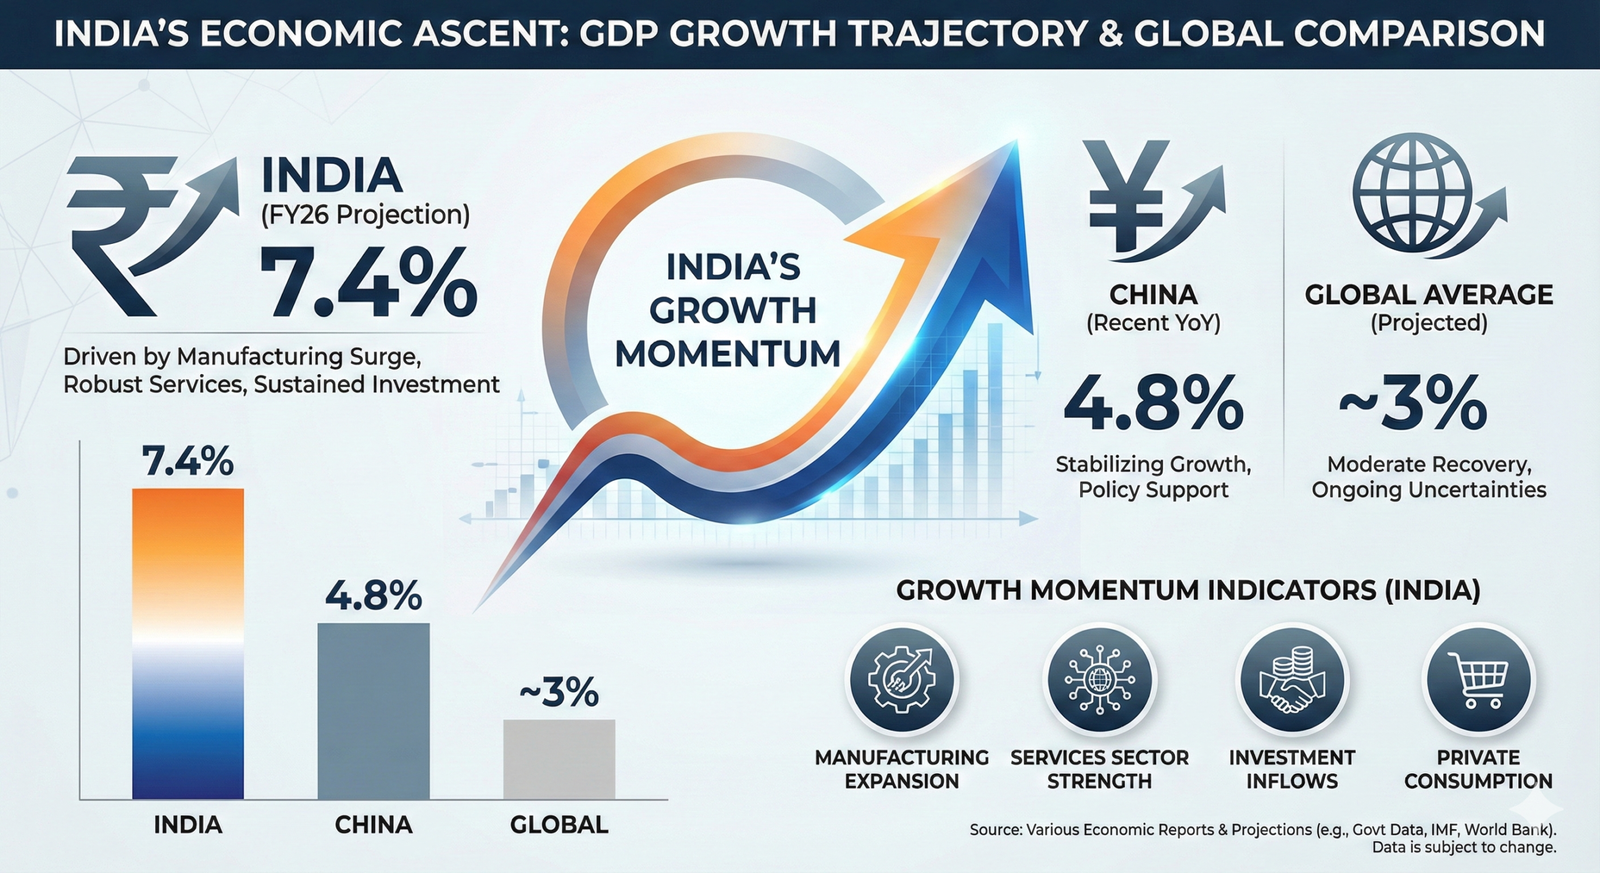
India’s 7.4% growth rate in FY26 establishes the nation as the world’s fastest-growing major economy. The comparative perspective is striking:
- China: 4.8% (Q2 FY26)
- Global Average: Approximately 3%
- Developed Economies: 1.5-2.5% range
This demonstrates that while the global economy is decelerating, India not only maintains accelerated growth but has surpassed China—a historic milestone in economic positioning. This growth trajectory reflects India’s structural resilience and the effectiveness of policy interventions implemented over the past fiscal year.
B. Q2 Showcase Performance: The 8.2% Leap
The second quarter (July-September 2025) recorded India’s GDP growth at 8.2%, the highest in six quarters. This represents a significant acceleration from Q1’s 7.8% and a dramatic improvement from Q2 FY25’s 5.6%. Understanding the drivers behind this acceleration is crucial for GPSC preparation.
II. Sectoral Performance: Who’s Leading the Growth?
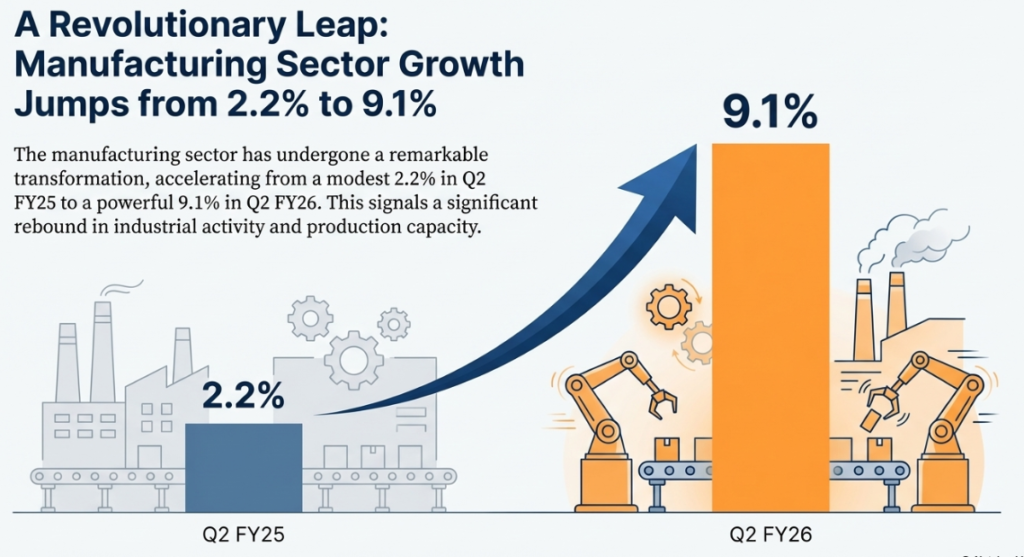
A. Manufacturing: Revolutionary Jump from 2.2% to 9.1%
Manufacturing sector’s performance represents the most striking transformation. Where Q2 FY25 recorded merely 2.2% growth, Q2 FY26 achieved 9.1%—a transformative leap with three primary drivers:
1. GST Rate Cut Anticipation
On September 22, 2025, Prime Minister Narendra Modi announced GST rate reductions on over 200 items. Manufacturers responded by ramping up production in anticipation of festival-season demand, creating a supply-side boost that translated into higher output figures.
2. Base Effect Advantage
The comparison against Q2 FY25’s weak 2.2% base naturally inflates the year-on-year growth rate. This is a crucial statistical concept for GPSC aspirants to understand when analyzing economic data—growth rates must always be contextualized against previous-year comparisons.
3. Capacity Utilization Improvement
Across various manufacturing segments, capacity utilization improved from 70% to 80%, indicating better resource optimization and confidence in demand sustainability.
This manufacturing resurgence matters significantly because:
- Manufacturing accounts for substantial employment generation
- It’s fundamental to India’s “Make in India” initiative
- Export competitiveness depends on manufacturing efficiency
- Capital goods production signals long-term investment intentions
B. Services Sector: The Economic Backbone
The services sector grew at 9.2% in Q2, with the most impressive performance coming from Financial, Real Estate, and Professional Services—registering 10.2% growth, the highest in nine quarters.
Key Components Driving Services Growth:
- Banking and NBFC Sector: Credit growth acceleration with improving Non-Performing Asset (NPA) ratios indicate financial system health and increased lending appetite.
- Real Estate: Infrastructure spending initiatives created demand rebounds in construction-linked services.
- IT and Digital Services: Expansion of India’s digital economy, despite international headwinds, continues strengthening this critical export sector.
- Travel and Logistics: Post-pandemic recovery dynamics persist, with improved mobility and trade flows.
The services sector’s significance cannot be overstated: it contributes over 54% of India’s GDP and remains the primary source of India’s service exports, which are critical for balance-of-payments stability and capital inflows.
C. Agriculture: Weather-Dependent Moderation
Agricultural growth decelerated from 4.1% (Q2 FY25) to 3.5% (Q2 FY26). Contributing factors include:
- Uneven monsoon distribution across regions
- Localized drought conditions in specific agricultural zones
- External supply-chain disruptions
However, given the overall favorable monsoon assessment, agricultural output is expected to recover in subsequent quarters, particularly as harvest cycles progress and improved rainfall translates into better crop yields.
III. GST 2.0 Reform: A Policy Masterstroke
A. The Historic Rationalization
The GST 2.0 reform implemented on September 22, 2025, represents a significant turning point in India’s fiscal policy architecture. This comprehensive rationalization touched over 200 items with the following strategic restructuring:
Essential Goods and Services:
- Essential food items: 5% or 0% brackets
- Agricultural products: Moved to lower slabs
- Healthcare and Education: Expanded exemptions
- Construction materials: Reduced rates for infrastructure development
Consumer and Manufacturing Goods:
- Electronics and drones: Rationalized downward
- Textiles, leather, and handicrafts: Consolidated at 5%
- Automobiles and auto components: Staged rate reductions
B. Direct Impact on Consumer Purchasing Power
The combined effect of GST rationalization and middle-class income tax relief created measurable economic stimulus:
Quantifiable Benefits:
- Disposable Income Increase: Approximately Rs 1.5 trillion in additional household purchasing power
- Price Transmission: Immediate price reductions in 30 of 54 daily-use items
- Consumer Goods: Significant price reductions in electronics and automobiles
- Affordability Metrics: Real purchasing power improved by 3-5% across income segments
Demand Multiplier Effects:
- Households redirected savings into discretionary spending
- Deferred purchases (vehicles, durables) accelerated
- Rural consumption particularly responsive due to lower commodity prices
- FMCG (Fast-Moving Consumer Goods) benefited substantially from volume growth
C. Business Sector Advantages
GST 2.0 created a favorable operating environment for enterprises:
- Cost Structure Improvement: Reduced input taxes lowered production costs
- Margin Enhancement: Better cost efficiency translated into improved profitability
- Export Competitiveness: Lower input costs enhanced international competitiveness
- Business Confidence: Improved sentiment attracted capital investments
IV. Monetary Policy: RBI’s Strategic Easing
A. The 125 Basis Points Rate Reduction
From February 2025 through December 2025, the Reserve Bank of India executed a coordinated rate reduction program totaling 125 basis points, bringing the Repo Rate to 5.25%. This represents one of the most aggressive easing cycles in recent Indian monetary policy history.
The Inflation-Growth Dynamics:
The RBI’s rate reduction strategy was enabled by favorable inflation dynamics:
- CPI inflation declined to 1.55-1.66% (July-December 2025)
- This represented a significant undershoot of RBI’s 4% medium-term target
- The “below-target” inflation provided policy space for growth-supportive measures
- International commodity price moderation contributed to domestic price stability
Growth Support Rationale:
Despite Q2’s impressive 8.2% growth, RBI anticipated potential deceleration in H2 (second half) due to:
- Global trade tensions, particularly US tariff escalation
- Seasonal demand patterns in Q3 and Q4
- Private sector investment still registering subdued momentum
- External demand headwinds requiring domestic demand support
B. Credit Transmission and Economic Impact
RBI’s rate reductions facilitated improved credit availability:
Housing Segment: Lower EMI costs increased home purchase affordability, boosting real estate activity
Automobile Sector: Reduced financing costs, combined with GST cuts, drove vehicle sales acceleration
MSME Credit: Small and medium enterprises accessed cheaper credit for working capital and expansion
General Consumption: Lower borrowing costs encouraged consumer financing across durables and discretionary categories
This transmission mechanism demonstrates how monetary policy operates through the financial system to stimulate real economy activity—a conceptually important distinction for GPSC aspirants studying economic policy transmission.
V. Government Expenditure: Fiscal Support Framework
A. Capital Expenditure Momentum
Government spending increased by 5.2% in FY26 compared to merely 2.3% the previous year. This acceleration, particularly in capital expenditure, reveals a deliberate policy choice to support growth through productive spending:
Infrastructure Investment Categories:
- Highway Expansion: National Highway Authority of India (NHAI) achieved record construction speeds
- Railway Capex: Highest levels in recent fiscal years for modernization and new corridors
- Port Infrastructure: Deep-water port development and capacity expansion
- Rural Infrastructure: Mahatma Gandhi National Rural Employment Guarantee Act (MNREGA) and village connectivity programs received enhanced allocations
Why This Matters for Long-Term Growth:
- Multiplier Economics: Every rupee of infrastructure spending generates Rs 1.5-2 of GDP impact
- Employment Creation: Infrastructure projects create employment across skill levels
- Productivity Gains: Better connectivity and infrastructure reduce business costs and transaction times
- Foundation for Private Investment: Public infrastructure attracts subsequent private sector investment
B. Fiscal Consolidation: Maintaining Discipline
A critical concern emerged: lower nominal GDP growth (8% achieved versus 10.1% budgeted) could jeopardize fiscal deficit targets. However, the actual outcome demonstrated fiscal resilience:
Favorable Fiscal Indicators:
- Nominal GDP at Rs 357.14 trillion exceeded budget assumptions
- Non-tax revenue collections performed better than projected
- Revenue expenditure remained controlled
- The 4.4% fiscal deficit target appears achievable despite headwinds
This balance between growth-supportive expenditure and fiscal discipline illustrates India’s improved macroeconomic management compared to previous cycles.
VI. External Headwinds: The Tariff Challenge
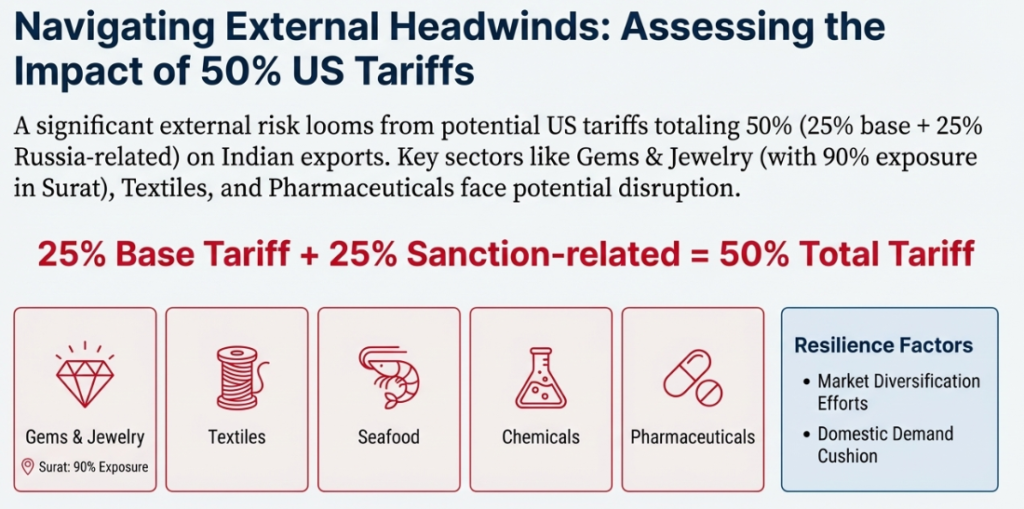
A. Magnitude of Trade Disruption
India faces unprecedented trade policy uncertainty, with US tariffs reaching 50% on Indian exports (25% base rate plus 25% additional tariffs related to Russian energy transactions). Most affected sectors include:
- Gems and Jewelry: 90% of global diamond cutting and polishing from Surat faces exposure
- Textiles: Indian apparel exports face margin compression
- Seafood: Shrimp and fish exports face restricted market access
- Pharmaceuticals: Potential threats to Indian generics industry
- Chemicals: Specialty chemicals face tariff walls
Additionally, proposed H-1B visa fee increases (potentially up to $100,000) threaten India’s IT services sector, which depends significantly on US-based assignments.
B. Growth Resilience Despite Tariff Pressure
Despite these headwinds, India’s 7.4% growth projection holds firm. This resilience reflects several protective factors:
1. Domestic Demand Dominance: Exports represent only 2% of India’s GDP, making the economy fundamentally domestic-demand-driven rather than export-dependent.
2. Rupee Depreciation Benefit: The Indian rupee’s depreciation from 83 per dollar to record lows provided natural hedging for exporters.
3. Inventory Build-Up: Manufacturers frontloaded production before potential tariff escalations, creating inventory buffers.
4. Services Sector Resilience: While goods exports face challenges, services exports—particularly IT, business process management, and financial services—remain less affected by tariffs.
This structural resilience demonstrates why India’s growth can sustain despite external shocks that would severely damage trade-dependent economies.
VII. Consumption: The Real Engine of Growth
A. Private Final Consumption Expenditure (PFCE) Acceleration
Private household consumption, the broadest measure of consumer demand, grew at:
- 7.0% projected for FY26 (full year)
- 7.9% recorded in Q2 (versus 6.4% in Q2 FY25)
This matters fundamentally because household consumption accounts for approximately 60% of India’s GDP. When consumption accelerates, it signals broad-based economic strength rather than sector-specific growth.
B. Rural Spending Dynamics
Rural consumption growth particularly stands out:
Contributing Factors:
- Better agricultural output from favorable monsoon conditions
- Lower food inflation improving purchasing power
- Festival season spending (Diwali and Holi periods)
- FMCG sector reporting significant rural demand surge
Rural areas, home to 65% of India’s population, are experiencing income growth and declining inflation simultaneously—the ideal consumption environment. This is particularly significant for GPSC preparation as it reflects inclusive growth patterns.
C. Urban Demand: Gradual Recovery Expected
Urban consumption currently faces headwinds:
- Corporate sector investment remains subdued
- Urban employment growth has moderated
- Higher-income segments showing spending caution
However, expectations remain that GST cuts and RBI rate reductions will progressively improve urban spending in coming quarters.
VIII. Potential Risks and Sustainability Concerns
A. US Tariff Escalation Risk
If the Trump administration extends tariffs to pharmaceuticals (potentially 200%+), India’s drug exports—a Rs 200 billion export category—faces severe compression. Additionally, MSMEs (which account for 45% of exports) would suffer disproportionately, creating potential employment disruptions.
B. Global Recession Scenario
A prolonged global slowdown would impact:
- Services exports (IT, business services) demand reduction
- Manufacturing export orders declining
- FPI (Foreign Portfolio Investment) reversals
- Remittance inflows potentially decreasing
C. Private Investment Lag
Government capex alone cannot sustain growth indefinitely. Persistent weakness in private corporate investment could decelerate growth in FY27, particularly if:
- Business confidence deteriorates
- Interest rates remain elevated relative to earnings
- Regulatory uncertainty persists
D. Agricultural Weather Dependency
Assuming a deficit monsoon in 2026, rural income contraction would directly depress consumption, particularly affecting food inflation and poverty reduction metrics.
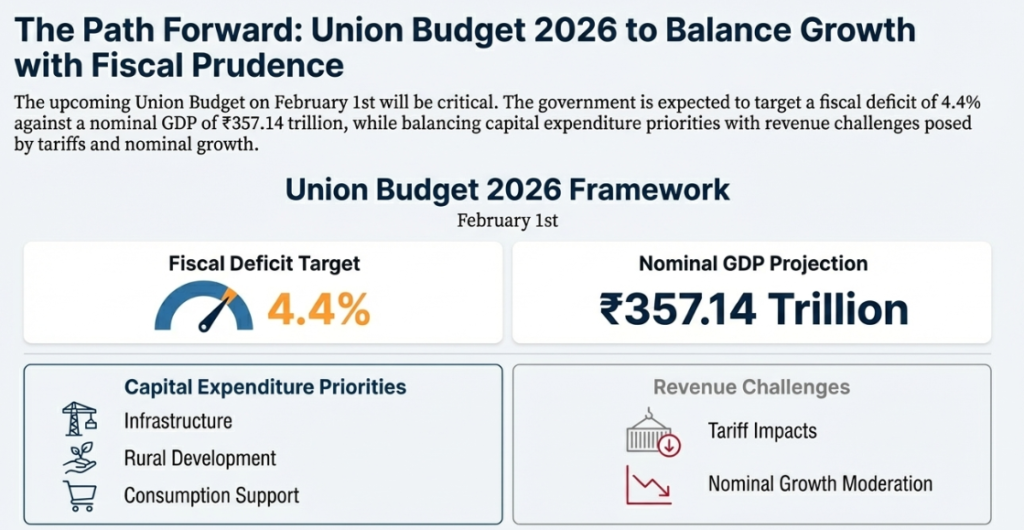
IX. Union Budget 2026 Outlook (February 1 Presentation)
A. Revenue Challenges and Collection Pressures
Lower nominal GDP growth (8% versus 10.1% budgeted) creates revenue shortfalls across:
- Income Tax: Direct tax collections may miss targets
- Excise and Customs: Trade tariffs reducing tariff revenue
- GST Collections: Partially offset by higher transaction volumes from lower rates
However, the government maintains expenditure flexibility given the improved nominal GDP actual versus budget assumption.
B. Expected Budget Priorities
Based on current economic context, the February 1 budget is anticipated to emphasize:
- Rural Income Enhancement: Direct income support and agricultural productivity programs
- Employment Generation: Expansion of the Employment-Linked Incentive scheme
- Consumption Support: Potential further income tax relief for middle class
- Infrastructure Continuation: Sustained capital expenditure on connectivity and productive assets
C. Policy Statement Themes
The budget presentation is expected to emphasize:
- “India’s resilience amid global uncertainties”
- “GST 2.0 delivering inclusive growth”
- “Fiscal consolidation on track at 4.4%”
- “Manufacturing revival and employment creation”
X. Key Takeaways for GPSC Aspirants
A. Current Affairs Essentials
Critical statistics and concepts for exam preparation:
- Growth Metrics: FY26 at 7.4%, Q2 at 8.2% (six-quarter high)
- Sectoral Leaders: Manufacturing 9.1%, Financial Services 10.2%, Services 9.2%
- Policy Drivers: GST 2.0 rationalization, RBI 125 bps rate cuts, Rs 1.5 trillion tax relief
- Global Context: India fastest-growing major economy, China at 4.8%, global average 3%
- External Challenges: 50% US tariffs, H-1B visa cost increases, Trump policy uncertainty
B. Conceptual Understanding for Mains Examination
GDP versus GVA: Understanding the distinction between Gross Domestic Product (spending approach) and Gross Value Added (income approach) is essential for comprehensive economic analysis.
Nominal versus Real Growth: The spread between 8% nominal and 7.4% real growth reflects inflation dynamics and is critical for understanding purchasing power implications.
Base Effect Mechanics: How lower previous-year comparisons inflate current-year growth rates—important for data interpretation.
Fiscal Multiplier Concept: How government capital expenditure generates multiple rounds of economic activity through supply chains.
Monetary Transmission Mechanism: How RBI rate cuts flow through the financial system to impact real economy decisions.
C. Strategic and Geopolitical Dimensions
- Economic Positioning: India’s growth leadership reflects policy credibility and structural advantages
- Tariff Resilience: Domestic-demand-driven model provides insulation against trade shocks
- Services Sector Advantage: IT, financial services, and business process management provide export diversification
- Development Trajectory: Growth-inflation combination (strong growth + low inflation) represents ideal macroeconomic state
XI. Conclusion: Is 7.4% Growth Sustainable?
The central question for long-term economic planning is whether India’s 7.4% growth trajectory can be maintained beyond FY26.
Positive Sustainability Factors:
✅ Services Sector Strength: Anchoring the economy with 10%+ growth rates provides a resilient growth base
✅ GST 2.0 Structural Reform: Long-term improvements in tax compliance, price transparency, and competitiveness
✅ Rural Demand Resilience: Inclusive growth pattern with rural income expansion supporting domestic demand
✅ Government Capital Investment: Multiplier effects from infrastructure spending creating productivity gains
✅ Low Inflation Environment: Provides policy flexibility for further rate reductions if needed
Sustainability Challenges:
❌ Private Investment Weakness: Corporate capital expenditure remains subdued despite policy incentives
❌ Trade Policy Uncertainty: US tariff escalation could disrupt manufacturing momentum
❌ Global Growth Slowdown: International demand weakness affecting export sectors
❌ Agricultural Volatility: Monsoon dependency creating seasonal demand fluctuations
❌ Base Effect Transition: Manufacturing growth partially reflects easy base-year comparisons
Realistic Outlook:
A sustainable growth rate of 6.5-7.5% appears achievable over the medium term (3-5 years) conditional upon:
- GST benefits translating into sustained consumption surge
- Private sector investment recovery in FY27-FY28
- Tariff situation stabilizing without further escalation
- Government maintaining capex discipline within fiscal deficit targets
- Agricultural output remaining above-trend
If any of these conditions deteriorate significantly, growth could decelerate toward 5.5-6%, which while still respectable globally, would represent a slowdown from current trajectories.
GPSC Perspective:
This economic data demonstrates how structural reforms translate into measurable improvements in GDP growth, even amid external challenges. It exemplifies government effectiveness in policy implementation—particularly evident in the coordinated GST-monetary policy-fiscal policy framework that simultaneously achieved growth acceleration and inflation reduction.
For GPSC exam preparation, memorize not just the headline 7.4% figure, but understand the policy mechanisms, sectoral drivers, and sustainability factors that underpin this growth trajectory. This multi-dimensional understanding distinguishes excellent GPSC candidates from merely adequate ones.